Here you will see example how to quickly setup tracing.
1. Select nodes
Using Nodes tab specify which nodes you want to trace. If you have already started node from erlide simply click Add existing nodes to add this node and enable it checking checkbox in Enabled column.
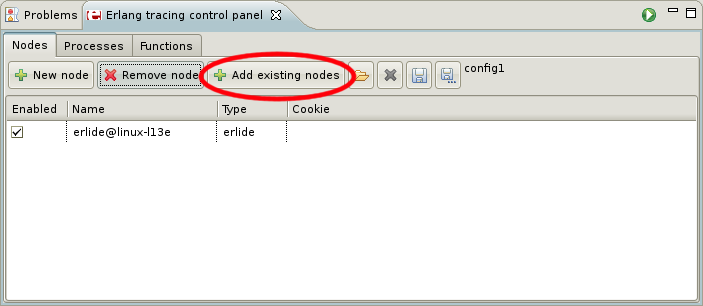
If you want to connect to an external node, start it with a long name and in the view use the full name, just like it is shown in the node’s shell prompt.
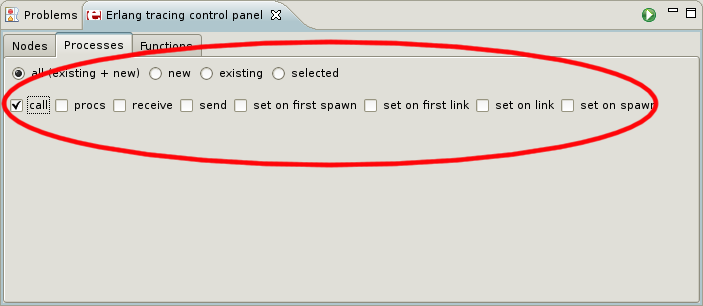
2. Set process flags
In Processes tab set which process should be traced (you can leave “all”) and set flags. To trace function calls set “call” flag.
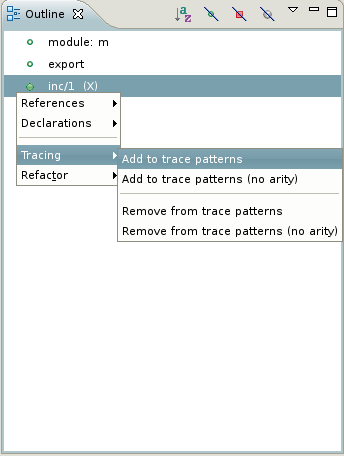
3. Add trace patterns
In Outline view right click on function you want to trace and choose from context menu: Tracing>Add to trace patterns.
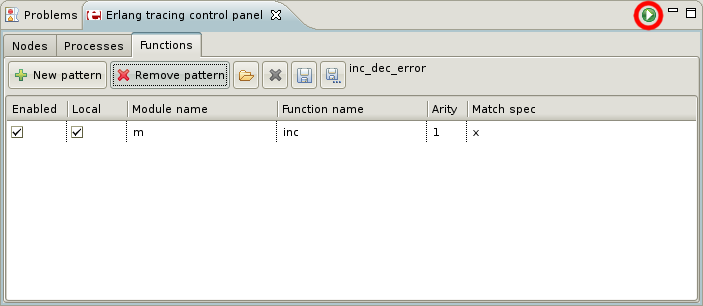
In “Functions” tab you will see your pattern:
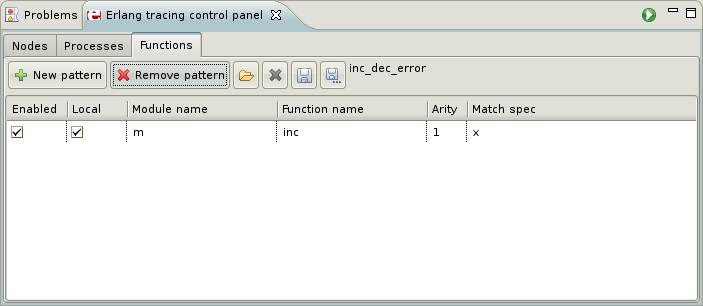
4. Start tracing
Start tracing clicking Start tracing icon:
5. Run your program and perform some action
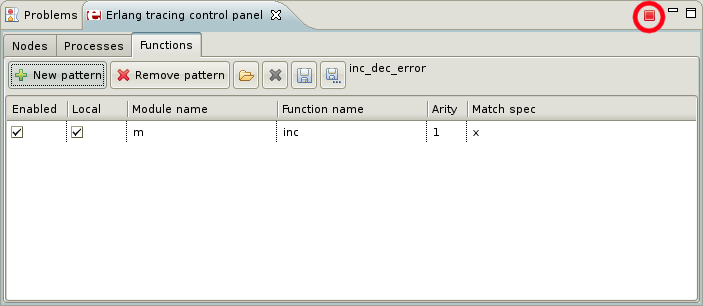
6. Finish tracing clicking Stop tracing icon
7. In trace browser you will see results of tracing
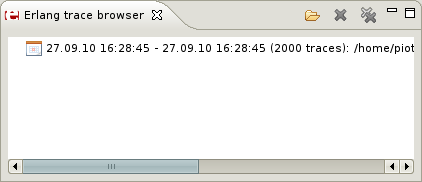
8. If you select results of tracing you will see all events in tree viewer
You can open in editor function’s or module’s definition by double clicking on it’s name in tree viewer.
Did you find errors in the documentation? Do you have improvements to suggest? Suggest edits!